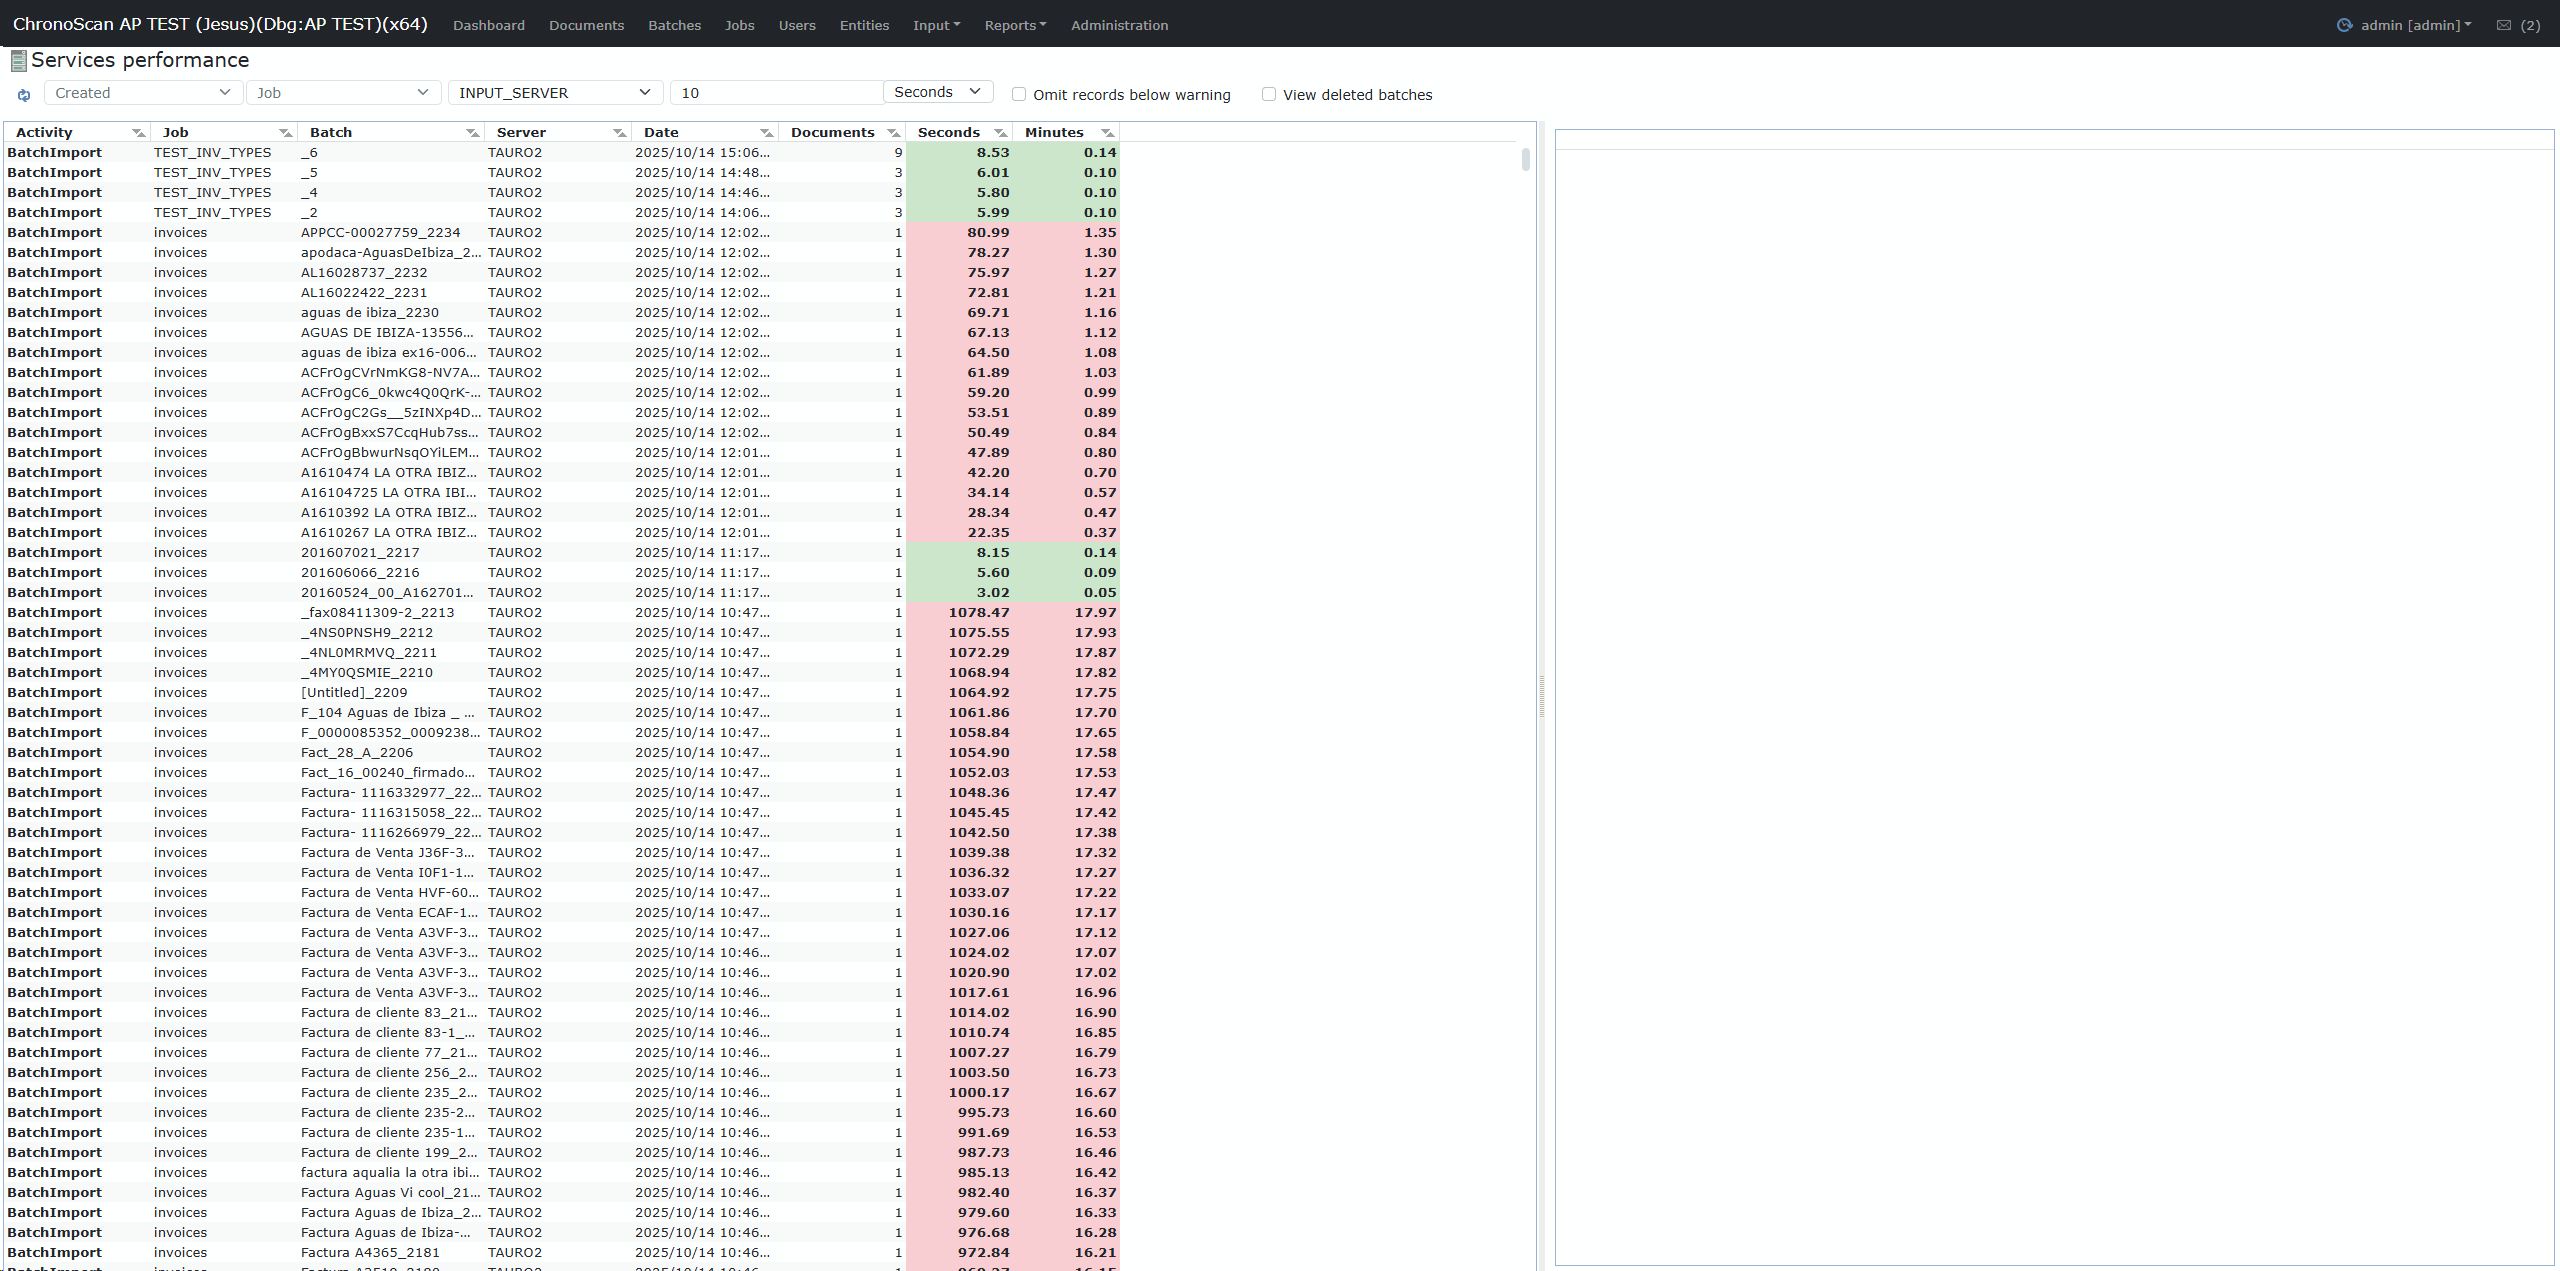
|
Control/Filter
|
Description
|
|
Created
|
Filter by creation date/time of the execution
|
|
Job
|
Focus on executions related to a specific job or workflow
|
|
Service/Server
|
Select which service type or server (e.g. INPUT_SERVER, PROC_SERVER, OUTPUT_SERVER)
|
|
Warning threshold (numeric)
|
Set the seconds/minutes threshold above which executions are highlighted in red
|
|
Time units (Seconds/Minutes)
|
Choose whether times are shown in seconds or minutes
|
|
Omit records below warning
|
Exclude (hide) executions whose duration is below your threshold
|
|
View deleted batches
|
Include executions involving batches that have since been deleted
|
|
Clear filters
|
Reset all filters and show the unfiltered list of executions
|
|
Field
|
Description
|
|
Activity
|
The type of executed process (e.g., BatchImport)
|
|
Job
|
The job or workflow associated with the execution
|
|
Batch
|
Identifier of the processed batch
|
|
Server
|
Name of the server or engine that performed the operation
|
|
Date
|
Start date and time of the execution
|
|
Documents
|
Number of documents involved in the execution
|
|
Seconds
|
Total time taken for the task, in seconds. Color-coded if above/below the warning threshold
|
|
Minutes
|
Total time taken for the task, in minutes. Same color highlighting logic as above
|