6.9.9.3. Services performance
Overview
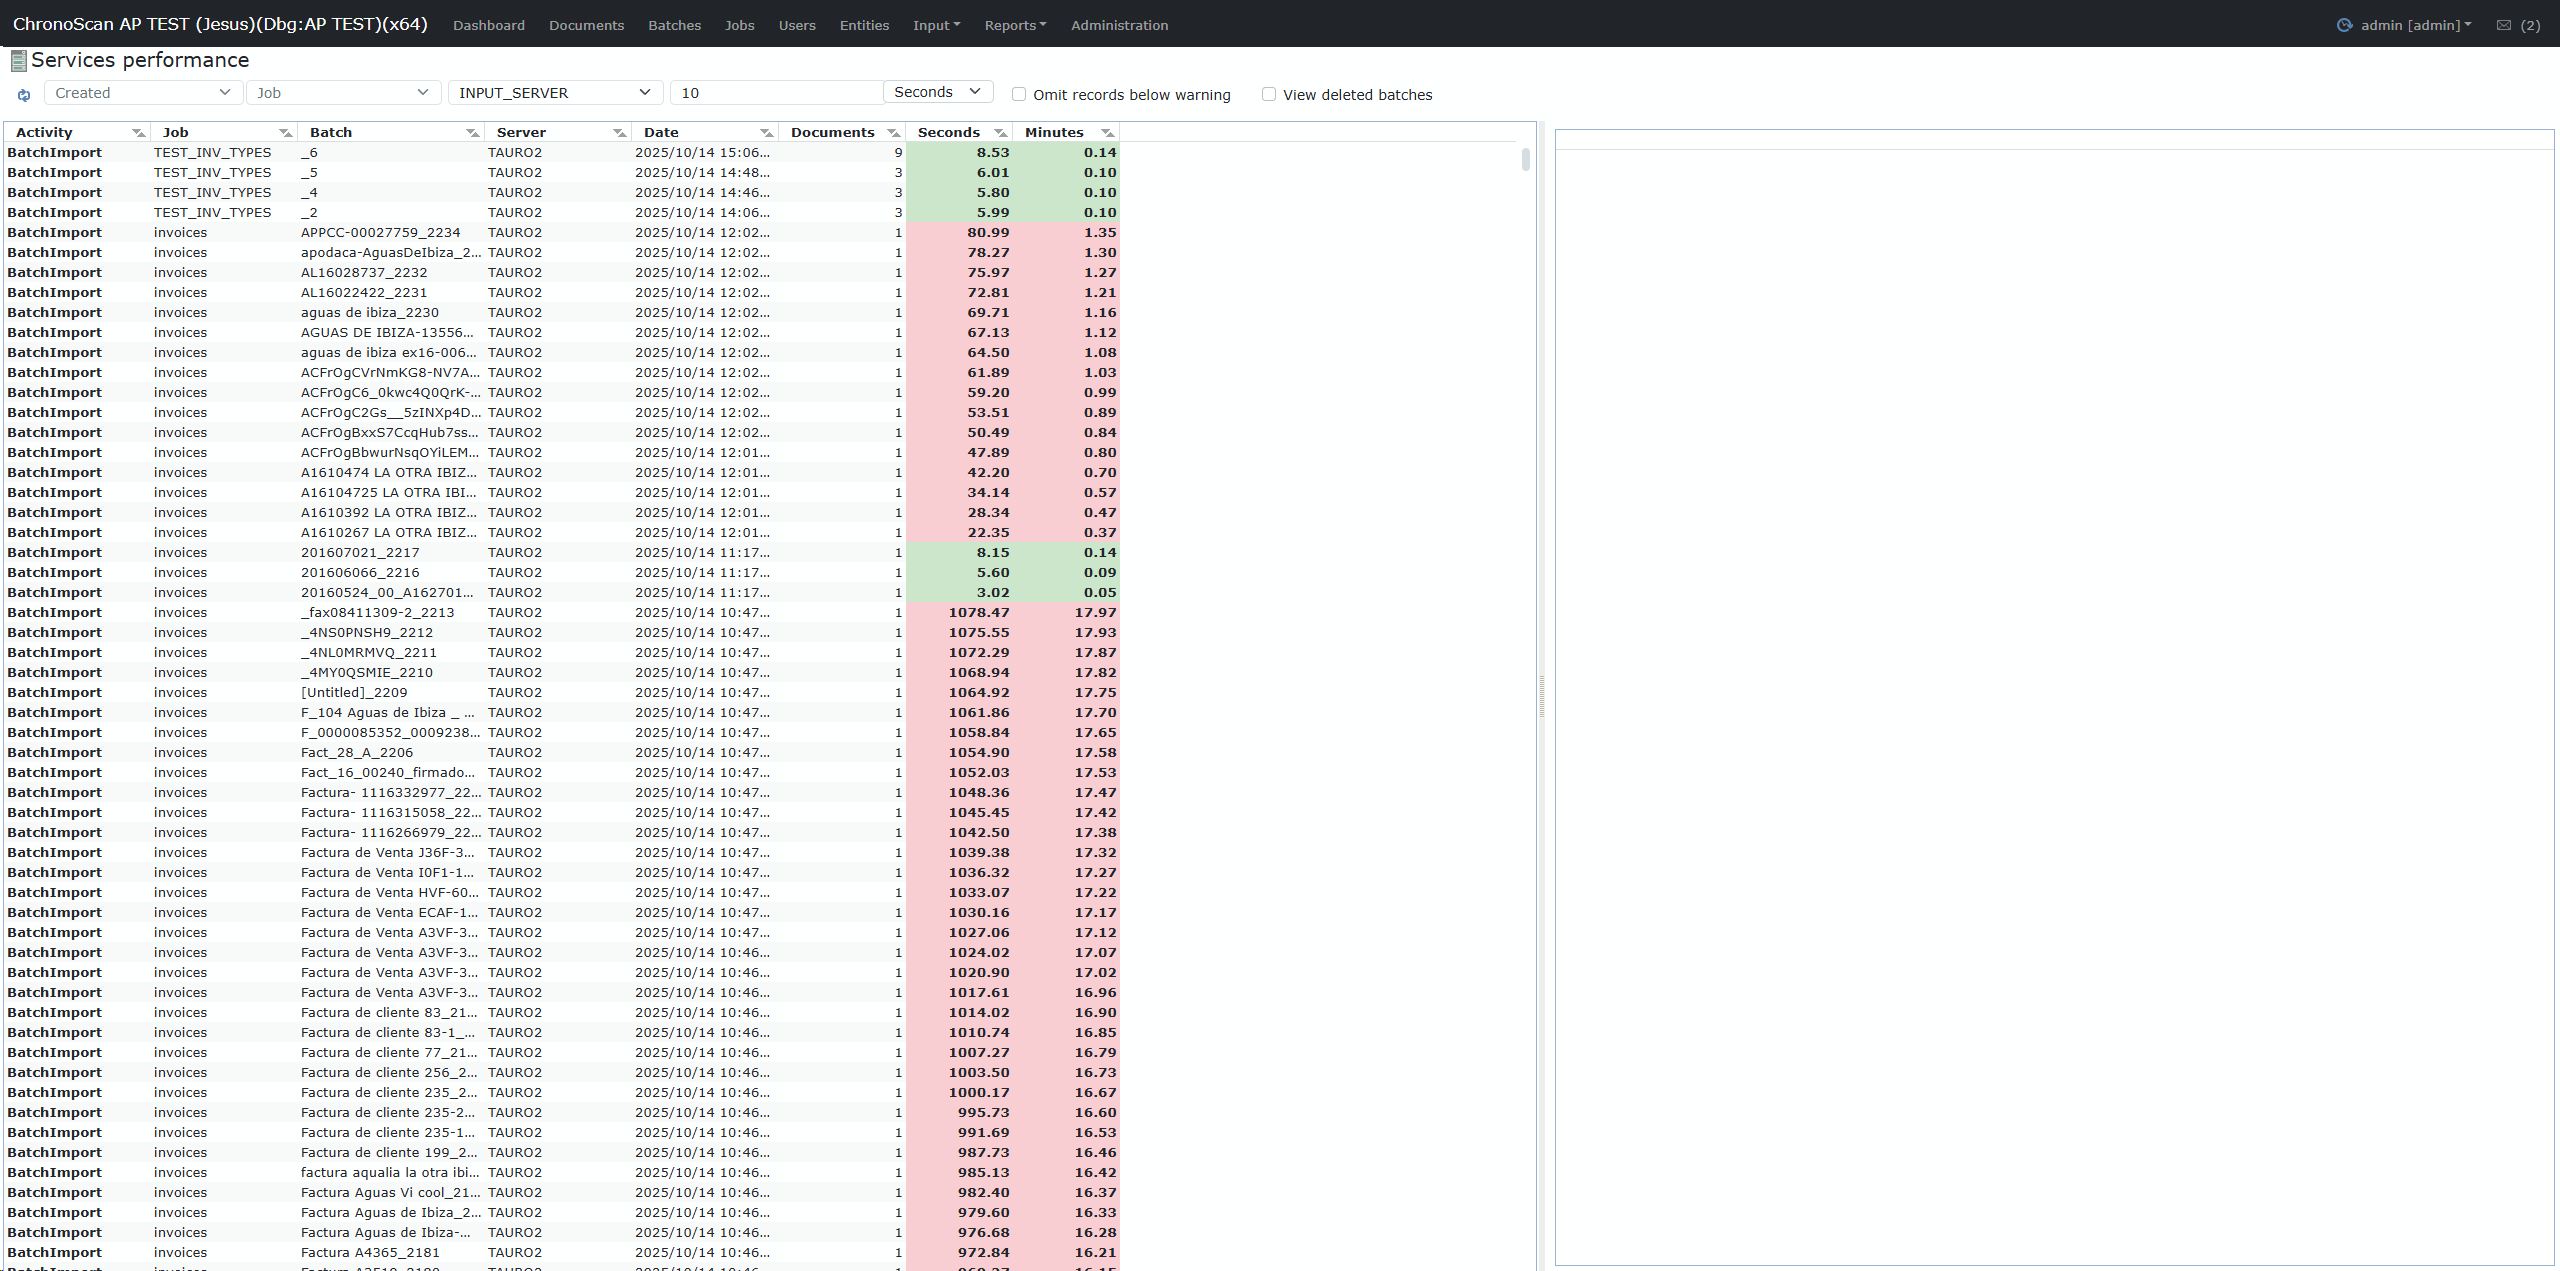
The Services Performance Report provides detailed tracking and analysis of all recorded executions performed by ChronoScan services and processing engines, such as batch imports and document workflow operations. It displays key metrics for each execution, pinpointing processing times, associated servers, jobs, and batches. Color highlighting (e.g. red for durations above a configurable threshold) helps you instantly identify unusually long or problematic processes.
Toolbar and Filters
|
Control/Filter
|
Description
|
|
Created
|
Filter by creation date/time of the execution
|
|
Job
|
Focus on executions related to a specific job or workflow
|
|
Service/Server
|
Select which service type or server (e.g. INPUT_SERVER, PROC_SERVER, OUTPUT_SERVER)
|
|
Warning threshold (numeric)
|
Set the seconds/minutes threshold above which executions are highlighted in red
|
|
Time units (Seconds/Minutes)
|
Choose whether times are shown in seconds or minutes
|
|
Omit records below warning
|
Exclude (hide) executions whose duration is below your threshold
|
|
View deleted batches
|
Include executions involving batches that have since been deleted
|
|
Clear filters
|
Reset all filters and show the unfiltered list of executions
|
Main Data Fields
|
Field
|
Description
|
|
Activity
|
The type of executed process (e.g., BatchImport)
|
|
Job
|
The job or workflow associated with the execution
|
|
Batch
|
Identifier of the processed batch
|
|
Server
|
Name of the server or engine that performed the operation
|
|
Date
|
Start date and time of the execution
|
|
Documents
|
Number of documents involved in the execution
|
|
Seconds
|
Total time taken for the task, in seconds. Color-coded if above/below the warning threshold
|
|
Minutes
|
Total time taken for the task, in minutes. Same color highlighting logic as above
|
How It Works & Usage
-
Executions that exceed the specified "red warning" duration are automatically highlighted to help you quickly spot slow or problematic cases.
-
Choose the Service (INPUT/PROC/OUTPUT) to monitor data ingest, internal processing, or export performance individually.
-
Use "Omit records below warning" to focus only on processes that might be problematic or require investigation.
-
Include or exclude deleted batches if you want to audit historical performance—even for data/cases that no longer exist in the system.
-
Sorting and filtering by Job, Batch, Server, or Date allow for pinpoint root cause analysis and load distribution review.