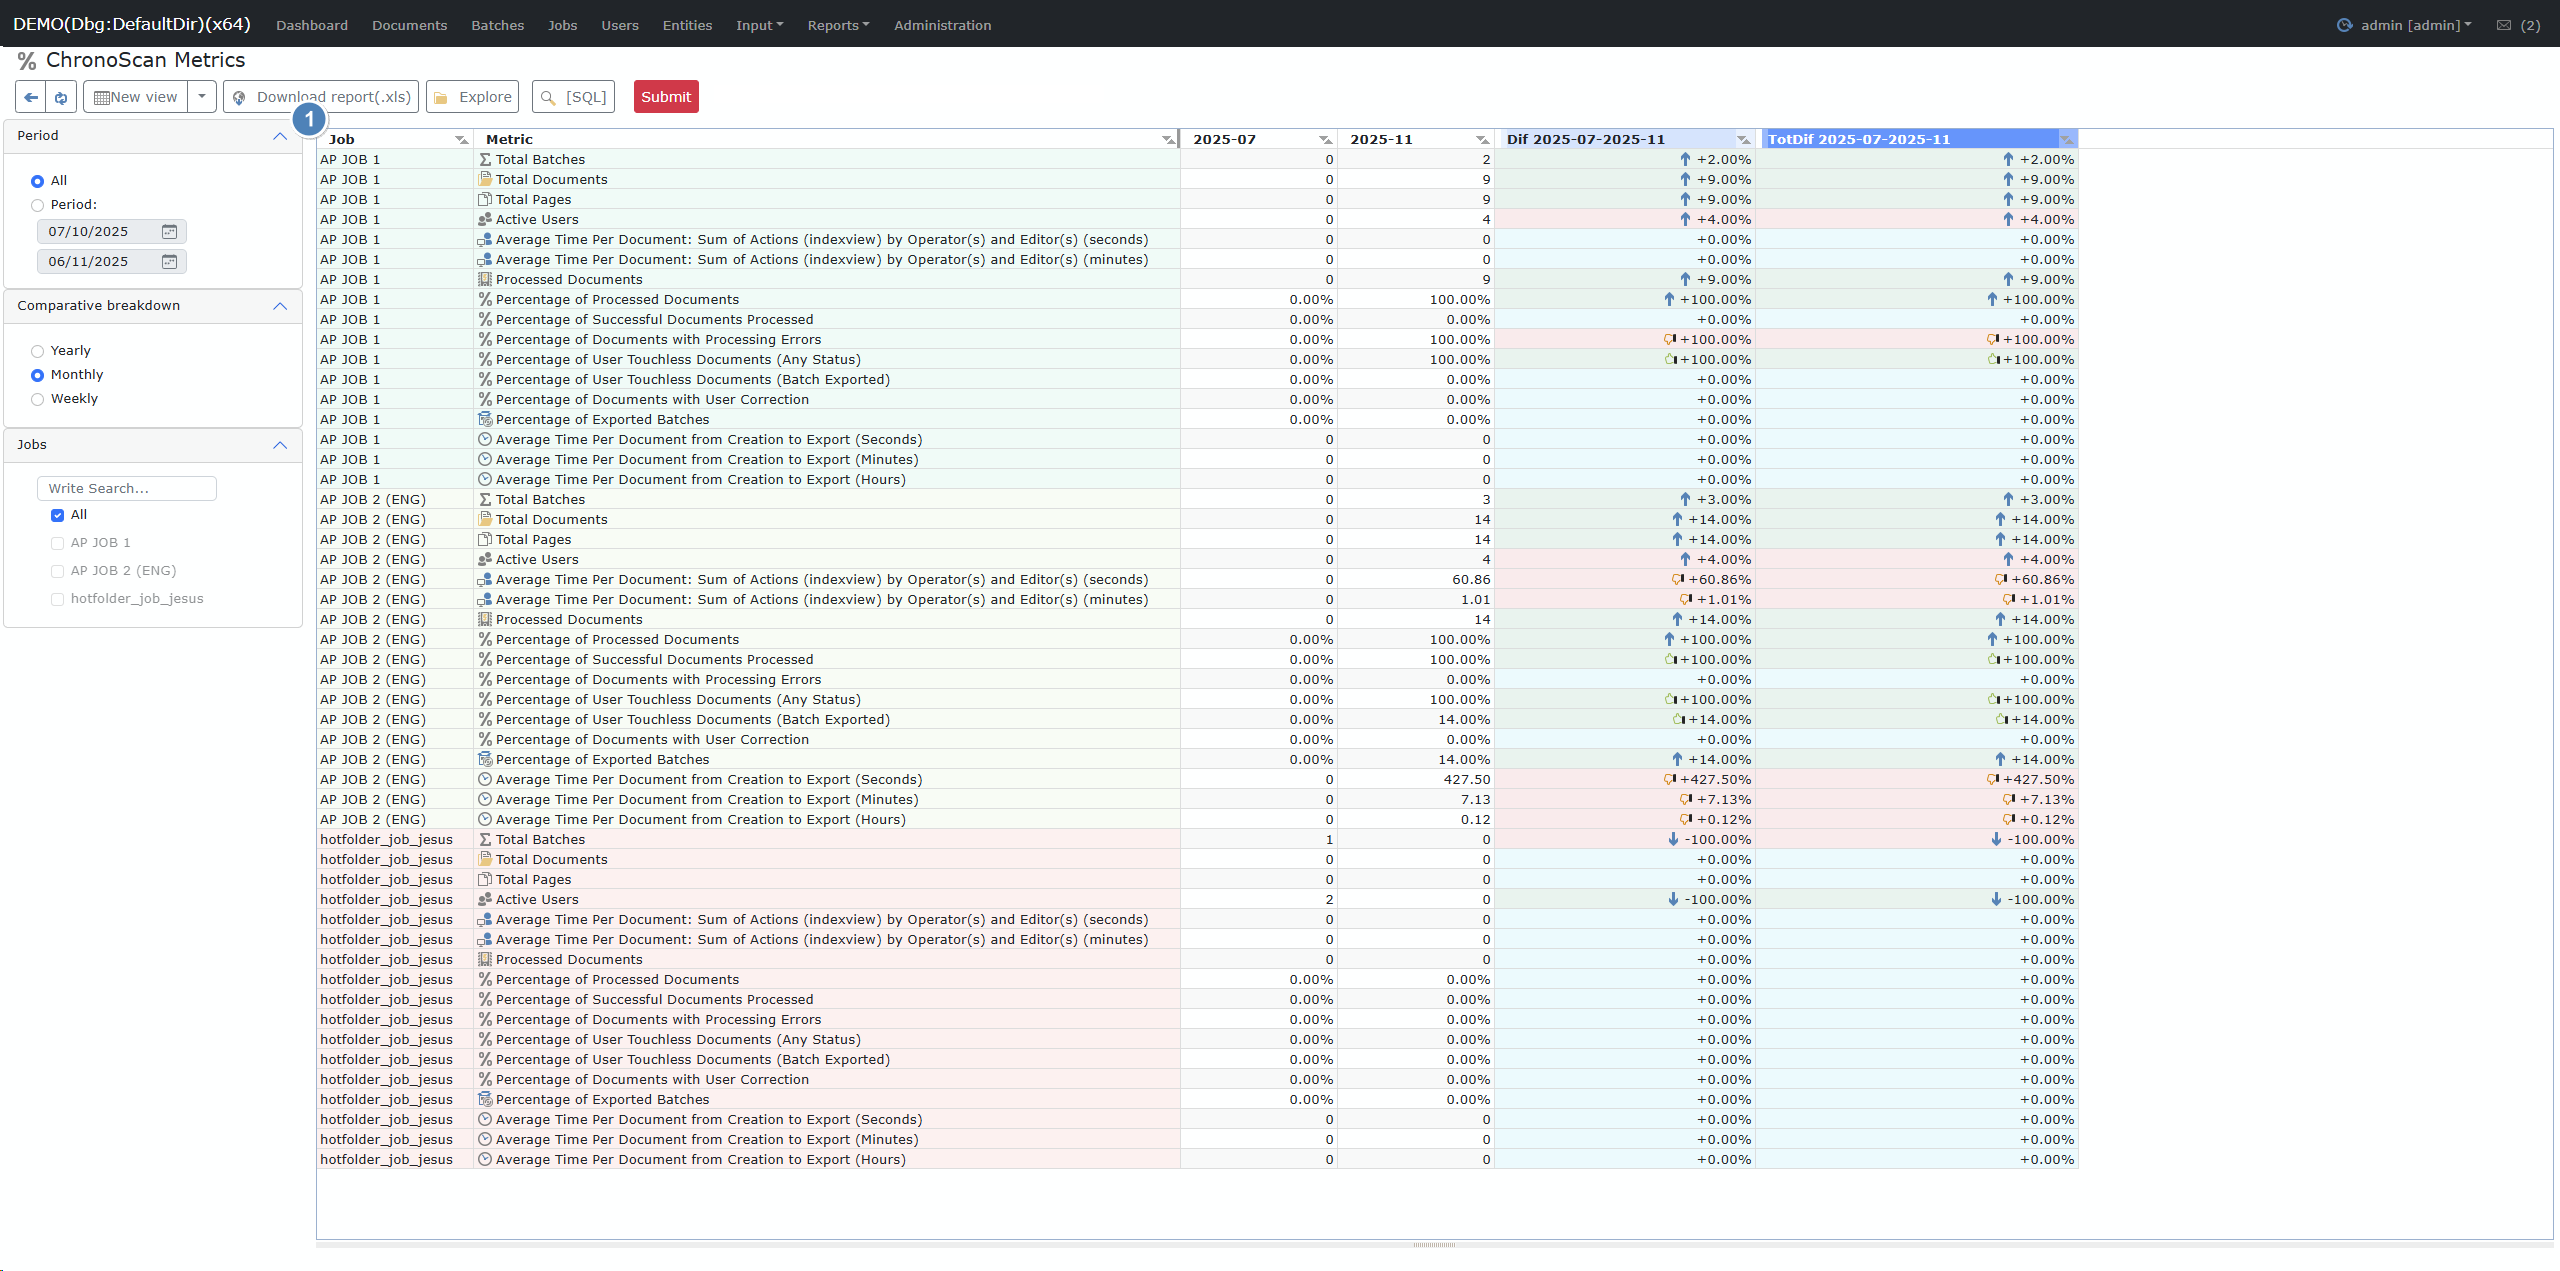
This report provides a comprehensive summary and comparison of key workflow metrics for each Job, across selected periods. It allows monitoring of document processing, user activity, and performance indicators, as well as period-to-period changes for audit and optimization purposes.
Fields/Columns
Column
Description
Job
Name of the job or process.
Metric
The specific metric being measured (see sample metrics below).
[Period 1], [Period 2], ...
Individual columns for each period selected (e.g. months/weeks/days). Values for each metric/job.
Dif [Period1-Period2]
Shows the difference between periods (as value or percentage), indicating increase or decrease.
TotDif [Period1-Period2]
Shows the total or cumulative difference between the compared periods.
Sample Metrics:
Total Batches
Total Documents
Total Pages
Active Users
Average Time Per Document: Sum of Actions (by operator/editor) [seconds/minutes]
Processed Documents
Percentage of Successful Documents Processed
Percentage of Documents with Processing Errors
Percentage of User Touchless Documents
Percentage of User Touchless Documents (Batch Exported)
Percentage of Documents with User Correction
Percentage of Exported Batches
Average Time Per Document from Creation to Export [seconds, minutes, hours]
# Toolbar
#
Button
Description
1
View Manager
Save, load, or delete filter/view sets for quick access to custom configurations.
2
Download Report (.xls)
Export the currently displayed metrics table to an Excel file.
3
Explore
Open the file explorer to access previously generated reports.
4
[SQL]
(Admin/Debug only): Show or copy the SQL query used to generate the report.
5
Submit
Generate or refresh the report using the selected filters and configuration.
# Filters
#
Filter
Description
1
Period
Select a date range to define which periods are shown as columns.
2
Comparative Breakdown
Choose if period comparison is Yearly, Monthly, or Weekly.
3
Jobs
Filter which jobs to include in the metrics report.
How Comparative Breakdown Works
The "Comparative Breakdown" lets you compare metrics across multiple periods (yearly, monthly, weekly).
For each selected period, a column is added in the report showing metric values during that span.
Difference columns (Dif/TotDif) visualize changes (growth, drop, or stability).
Color coding and icons (arrows) help visually identify increases or decreases.