6.9.4. ChronoScan Metrics
Overview
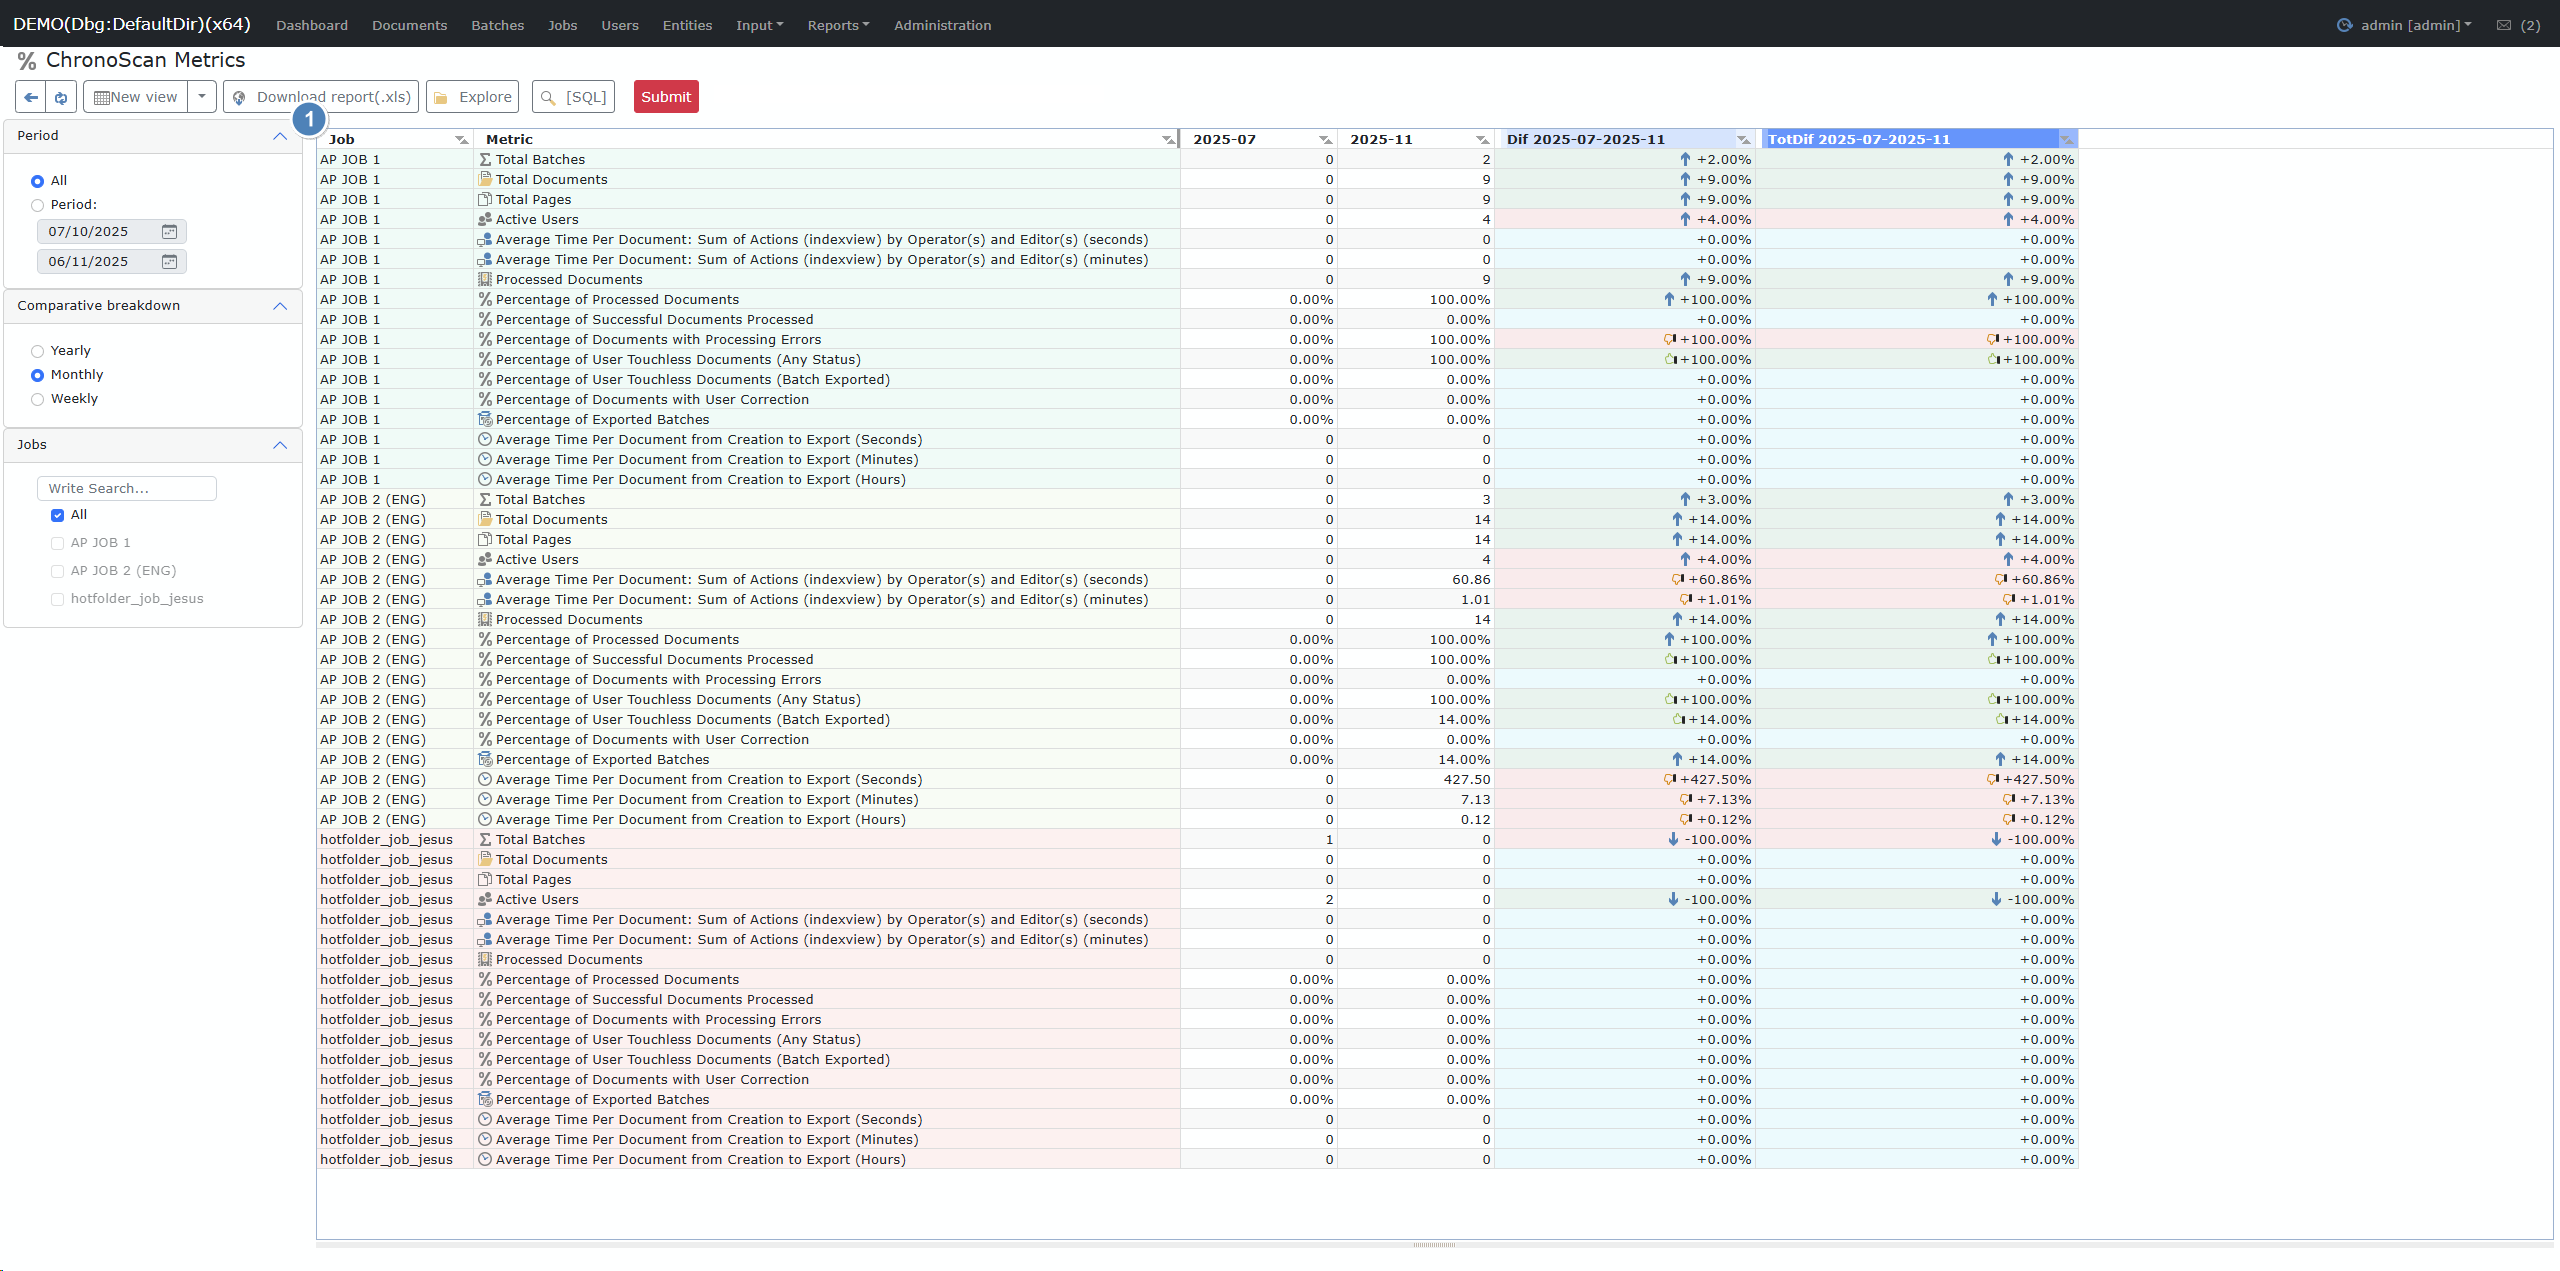
This report provides a comprehensive summary and comparison of key workflow metrics for each Job, across selected periods. It allows monitoring of document processing, user activity, and performance indicators, as well as period-to-period changes for audit and optimization purposes.
Fields/Columns
|
Column
|
Description
|
|
Job
|
Name of the job or process.
|
|
Metric
|
The specific metric being measured (see sample metrics below).
|
|
[Period 1], [Period 2], ...
|
Individual columns for each period selected (e.g. months/weeks/days). Values for each metric/job.
|
|
Dif [Period1-Period2]
|
Shows the difference between periods (as value or percentage), indicating increase or decrease.
|
|
TotDif [Period1-Period2]
|
Shows the total or cumulative difference between the compared periods.
|
Sample Metrics:
-
Total Batches
-
Total Documents
-
Total Pages
-
Active Users
-
Average Time Per Document: Sum of Actions (by operator/editor) [seconds/minutes]
-
Processed Documents
-
Percentage of Successful Documents Processed
-
Percentage of Documents with Processing Errors
-
Percentage of User Touchless Documents
-
Percentage of User Touchless Documents (Batch Exported)
-
Percentage of Documents with User Correction
-
Percentage of Exported Batches
-
Average Time Per Document from Creation to Export [seconds, minutes, hours]
# Toolbar

|
#
|
Button
|
Description
|
|
1
|
View Manager
|
Save, load, or delete filter/view sets for quick access to custom configurations.
|
|
2
|
Download Report (.xls)
|
Export the currently displayed metrics table to an Excel file.
|
|
3
|
Explore
|
Open the file explorer to access previously generated reports.
|
|
4
|
[SQL]
|
(Admin/Debug only): Show or copy the SQL query used to generate the report.
|
|
5
|
Submit
|
Generate or refresh the report using the selected filters and configuration.
|
# Filters
|
#
|
Filter
|
Description
|
|
1
|
Period
|
Select a date range to define which periods are shown as columns.
|
|
2
|
Comparative Breakdown
|
Choose if period comparison is Yearly, Monthly, or Weekly.
|
|
3
|
Jobs
|
Filter which jobs to include in the metrics report.
|
How Comparative Breakdown Works
-
The "Comparative Breakdown" lets you compare metrics across multiple periods (yearly, monthly, weekly).
-
For each selected period, a column is added in the report showing metric values during that span.
-
Difference columns (Dif/TotDif) visualize changes (growth, drop, or stability).
-
Color coding and icons (arrows) help visually identify increases or decreases.